Hide Pages without using any Script/Code


1. Go to Edit > Document Properties > General

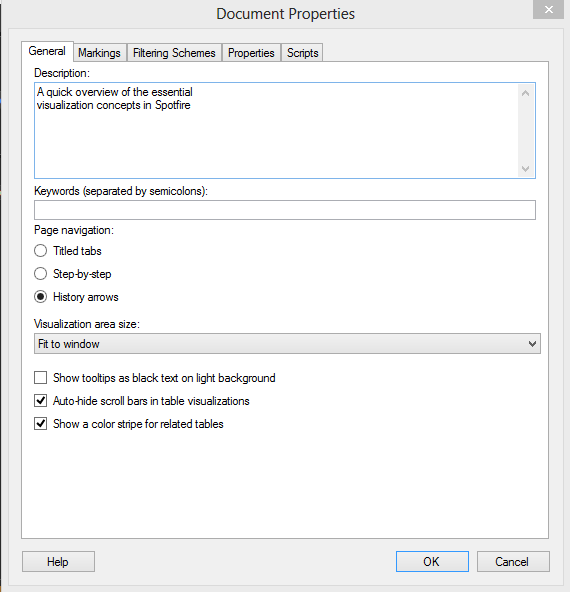
2. Set Navigation Mode to History Arrows.
3. Add a text area to be used as Navigation Bar.
4. Edit Text Area 
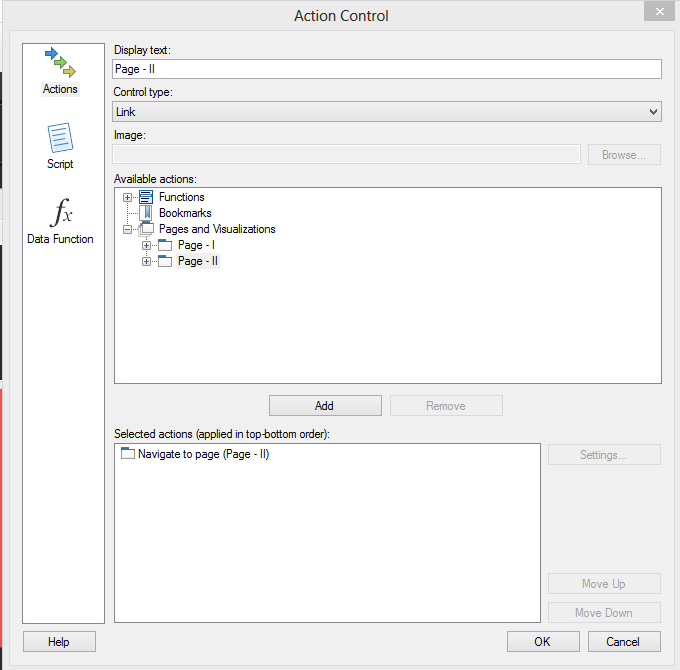
5. Insert Action Control.
6. Set Control type to "Link" (or based on your preference), and add Action Pages and Visualization > Page - II

7. Repeat Step 6 & 7 for pages you want to show.

Done
Share:

Read Table Visualization data in a string using IronPython

Read Table Visualization data in a string using IronPython

Read Table Visualization data in a string using IronPython

Script

Information

The Script provided here can be used to read Table Visualization data in a string using IronPython in Spotfire Analysis file.

Variables

#tablePlot is Table Plot Visualization
Web Page to PDF Converter
Share:

Apply User based security using IronPython

Apply User based security using IronPython

Apply User based security using IronPython

Script

Information

The Script provided here can be used to apply user based security using IronPython in Spotfire Analysis file. The scrip provided here discusses about three different types of Security based on current logged user.

Variables

#dt is Data Table
Web Page to PDF Converter
Share:

Apply Filter from text input using IronPython

Apply Filter from text input using IronPython

Apply Filter from text input using IronPython

Script

Information

The Script provided here can be used to apply Filter from text input using IronPython in Spotfire Analysis file . Here script is applying filter on Datatable column 'Nature'.

Variables

#txtInput is Text Input Property control #dt is Data Table
Web Page to PDF Converter
Share:

Toggle stack mode of Bars in BarChart visualization from python

Toggle stack mode of Bars in BarChart visualization from python

Toggle stack mode of Bars in BarChart visualization from python

Script

Information

The Script provided here can be used to toggle stack mode of Bars in BarChart visualization .

Variables

#v is BarChart Visualization reference
Web Page to PDF Converter
Share:

Set BarChart Visualization Transparency from python

Set BarChart Visualization Transparency from python

Set BarChart Visualization Transparency from python

Script

Information

The Script provided here can be used to set transparency of Bars in BarChart visualization .

Variables

#vis is BarChart Visualization reference #tnum is Real value between 0.0 and 1.0, residing in a property, and represents transparency level
Web Page to PDF Converter
Share:

Update Manual trellis layout of Visualization

Update Manual trellis layout of Visualization

Update Manual trellis layout of Visualization

Script

Information

The Script provided here can be used to set Manual trellis layout programatically. Assuming that trellis is initialised in panel mode already.

Variables

#expr is a string containg Trellis PanelAxis expression stored in Property #TrellisSelector is a string containg layout indicator stored in Property
Web Page to PDF Converter
Share:

Update Color By Expression of Visualization

Update Color By Expression of Visualization

Update Color By Expression of Visualization

Script

Information

The Script provided here can be used to update color by expression for a visualization with color axis. If visualization doesn't have any ColorAxis, script doesn't perform any action.

Variables

#v is BarChart reference #expr is a expression string stored in Property
Web Page to PDF Converter
Share:

Row count for the occurrences of a cell value in a column

Row count for the occurrences of a cell value in a column

Row count for the occurrences of a cell value in a column

Script

Information

The Script provided here gives the row count for the occurrences of a cell value in a column specified, given condition is - the filter type of the column should be check box filter in Active Filtering Scheme.

Variables

#myDataTable : DataTable reference to apply filter on #regionName : Cell Value to be counted
Web Page to PDF Converter
Share:

Hide all but Color by in Legend

Hide all but Color by in legend

Hide all but Color by in legend

Script

Information

The Script provided here hides all but Color by in legend, including color axis selector and title in active page of analysis. If a visualization doesn't have color by legend of legend option itself (e.g. TextArea), the script simply ignores that Visualiztion.

Variables

#NA
Web Page to PDF Converter
Share:

Build Information Links for a complex SQL Query

Build Information Links for a complex SQL Query

Build Information Links for a complex SQL Query

Steps

Information

The steps provided here can be used to build Information Links for a complex SQL Query, which may contain multiple sub-queries,joins, group by. order by etc.

Notes:

  1. All the joined tables should be in same schema and DB.
  2. The Data on demand setup with this approach may create some issues, if resulting SQL query is not configured properly.
  3. in order to make IL support Data on Demand, "and " should be palced in according to SQL where clause.
Share:

Extract unique values in Data Table Column

Extract unique values in Data Table Column

Extract unique values in Data Table Column

Script

Information

The Script provided here can be used to extract unique values in Data Table Column in Plain Text format.

Variables

#activeTable : Data Table containing target column
Web Page to PDF Converter
Share:

Extract All Script from Spotfire Analysis in in Plain Text

Extract All Script from Spotfire Analysis in in Plain Text

Script

Information

The Script provided here can be used to extract All Script from current Spotfire Analysis file in Plain Text format.

Variables

#NA
Share:

Toggle Marking Behavior

Toggle Marking Behavior

Toggle Marking Behavior from Show Empty to Show All

Script

Information

The Script provided here can be used to toggle marking behavior of a visualization i.e. it can change the content to be displayed in case no items are marked in master visualization of current detailed visualization. The IronPython Script is programmed to change between Show all data and Show Empty visualization, in case nothing is marked in Master visualization.

Variables

#viz: Detailed Visualization
Web Page to PDF Converter
Share:

Convert Cross Table to Data Table

Convert Cross Table to Data Table

Convert Cross Table to Data Table

Script

Information

The Script provided here can be used to replace data in a data table with content in a cross table plot.

Variables

#viz: Cross Table Visualization
#dataTable: Target Data Table
Web Page to PDF Converter
Share: